The electoral reform proposed here is designed to re-engage the electors of NSW by ensuring that they are given genuine choice of major party candidates in the election of their parliamentary representatives.
The proportional representation model proposed here for the Legislative Assembly, and concurrent reform of the proportional representation system for the Legislative Council, will ensure:
These two points are the key to this proposal and, with the refinements outlined below, produce an electoral system under which fine distinctions in voting support will be accurately reflected in the composition of the parliament, but micro parties and opportunistic groupings will not be elected.
Other features include:
It is proposed to divide the state into five electorates. North East, North, West, South, and South East.
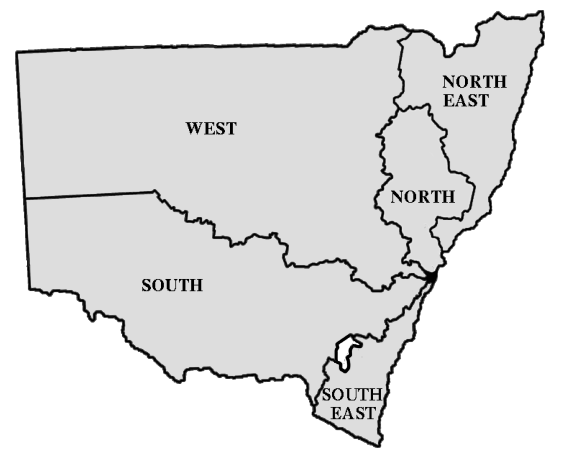 The proposed electorates of North, West, South and South East all
contain a portion of Sydney's greater metropolitan area and the adjacent
country/regional areas to the borders of the state. The electorate
of North East extends from the City of Newcastle north to the Queensland
border.
The proposed electorates of North, West, South and South East all
contain a portion of Sydney's greater metropolitan area and the adjacent
country/regional areas to the borders of the state. The electorate
of North East extends from the City of Newcastle north to the Queensland
border.
Each electorate elects nineteen members. The quota for election is 5.00%. The number of members elected to the Legislative Assembly is ninety five, an increase of two. (Note: The Legislative Council is reduced by four).
The sizes of the proposed electorates are as large as practicable ensuring that the quotas are small enough to enable fine distinctions in voting support to be reflected in the composition of the parliament.
The quotas are also large enough to ensure that micro parties and opportunistic groupings are not elected.
Any party that fails to obtain a quota (5.00%) would find it very difficult to have a candidate elected, thus eliminating the need to introduce any arbitrary threshold for election.
The electorates should be based on local government boundaries but for the purpose of this proposal, and to facilitate the analysis of the electorates (see appendices below), they are based on existing state electorates.
The Legislative Council would remain as presently constituted, with the state of NSW as the electorate. It is recommended that the number of members to be elected at each half Legislative Council election be reduced to nineteen. This makes the quota for election 5.00% (See appendices for the analysis of both 19 and 21 member Legislative Council elections for 2003 and 2007).
Many of the concepts in this proposal are the same as the author's proportional representation system proposed for the Australian Parliament.
For an explanation of the mechanics and benefits of proportional representation, Robson rotation, spreading of the vote, above-the-line voting, electoral deposits, star recruits and bulwark against landslides it is recommended that the reader see the companion proposal.
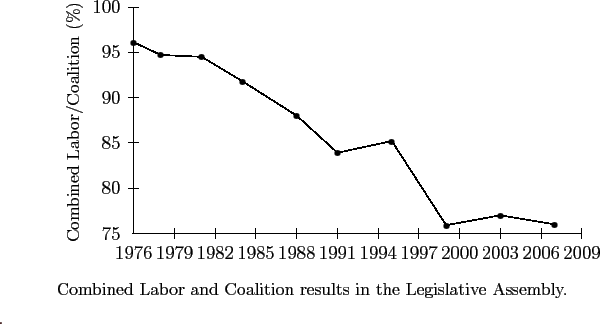
As the following graph demonstrates, the decline of the two party system is even more pronounced in the NSW Parliament than in the Australian Parliament.
| 1976 | 1978 | 1981 | 1984 | 1988 | 1991 | 1995 | 1999 | 2003 | 2007 | |
| Labor | 49.8 | 57.8 | 55.7 | 48.8 | 38.5 | 39.1 | 41.3 | 42.2 | 42.7 | 39.0 |
| Liberal | 36.3 | 27.0 | 27.6 | 32.2 | 35.8 | 34.3 | 32.8 | 24.8 | 24.7 | 26.9 |
| National | 10.0 | 9.9 | 11.2 | 10.8 | 13.7 | 10.5 | 11.1 | 8.9 | 9.6 | 10.1 |
| Comb Majors | 96.1 | 94.7 | 94.5 | 91.8 | 88.0 | 83.9 | 85.2 | 75.9 | 77.0 | 76.0 |
| Democrats | - | 2.6 | 2.4 | 2.8 | 1.8 | 5.4 | 2.8 | 3.3 | 0.9 | 0.5 |
| One Nation | 7.5 | 1.3 | - | |||||||
| Greens | 3.9 | 8.3 | 9.0 | |||||||
| Others | 3.9 | 2.7 | 3.0 | 5.4 | 10.2 | 10.8 | 12.0 | 9.4 | 12.5 | 14.5 |
Preferential voting and the tendency of politicians, pollsters and journalists to discuss election results in two party preferred terms have masked this general decline in the support for the major parties.
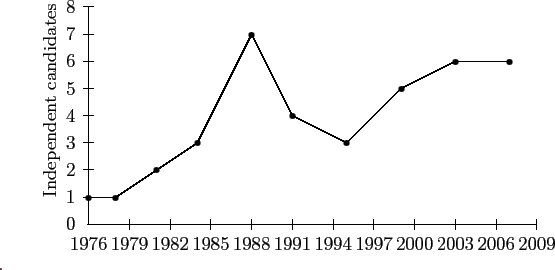
As the following histogram demonstrates, the decline in support for the two party system is also illustrated by the rise in the number of Independents being elected to the Legislative Assembly.1
If the rise in support for Independents and minor parties continues it will eventually undermine and destroy the two party system in Australia. In single member electorates Independents and minor parties only achieve limited success until their vote reaches approximately 25%. At this point substantial numbers of Independent and minor party candidates will have pushed one or other of the major parties to third place and can then expect to receive a major flow of preferences from the losing major party candidate.
The National Party in recent years has been a victim of this process. Independents have been able to capture and hold what were formerly strong National Party seats. The process is assisted by the ALP's preferencing the Independents and refusing to campaign in any meaningful way. The Labor Party itself is not immune to the phenomenon; the seat of Lake Macquarie is now held by an Independent and in the past Newcastle, Wollongong and Balmain were held by Independents. It could also be argued that the seat of Bligh/Sydney is nominally a Labor Party seat. A similar process cost the Liberal Party the seat of Pittwater in the 2005 by-election.
Once elected in single member electorates, Independents are reasonably secure from swings affecting the major political parties. The proposed model ensures that for Independents to be confident of being elected they will need to obtain their own quota and not merely rely on the preferences of the losing major party. All parties, particularly the major parties, will have an incentive to campaign positively in all regions of the State.
Despite all mainland states having single-member electorates for their lower houses minority governments are no longer an unusual phenomenon in Australia. As a direct result of the decline of the combined primary vote for the major parties most states in recent years, including NSW from 1991 to 1995, have experienced minority governments
At the next NSW election (2011) there will be a hung parliament if the Labor Government loses between six and eleven seats. Either the Labor Party or the Liberal/National coalition will have to form a minority government. The resulting government would need the support of Independents who have just asked their voters to reject party politics. The government could never be certain that its program would be supported. With fixed parliamentary terms the government would not be able to resolve any deadlocks by calling an early election. The situation would be very unstable, and the government could well be forced to resign mid-term and allow the opposition to try to form a government.
Under the proposed model the number of Independents elected will drop substantially. The analysis of the last two state elections shows that the Greens would have elected seven or eight members (see appendix). Unlike most independents the Greens have a platform and caucus, and as a result could be expected to come to an arrangement with one of the major parties either to form a coalition government or to support a minority government. It would then be in the interests of all parties to this arrangement to ensure its viability because all would be judged on its success or failure.
The commonly held fear that proportional representation will always produce minority governments is wrong. Under the proposed model the 2003 state election results would have given the Labor Party, with 42.7% of the vote, an absolute majority in the Legislative Assembly and a majority of the seats contested in the Legislative Council (see appendix).
It is the author's view that the support for independents and minor parties will decline as voters learn that they can vote within major party groups for individual candidates that they like or trust, or who represent their own interests more closely. This trend can be observed in recent ACT Legislative Assembly elections (see following table).
| ACT Legislative Elections | ||||
| Electorate | Party | 1998 | 2001 | 2004 |
| Brindabella | ALP | 28.5 | 44.0 | 45.7 |
| Liberal | 37.1 | 31.9 | 40.4 | |
| Combined Majors | 65.6 | 75.9 | 86.1 | |
| Ginninderra | ALP | 29.6 | 42.8 | 50.1 |
| Liberal | 33.1 | 27.9 | 32.4 | |
| Combined Majors | 62.7 | 70.7 | 82.5 | |
| Molonglo | ALP | 25.6 | 39.3 | 45.3 |
| Liberal | 41.5 | 34.1 | 32.6 | |
| Combined Majors | 67.1 | 73.4 | 77.9 |
It is essential for the full enfranchisement of NSW voters that optional preferential voting for the Legislative Assembly is maintained. There is no necessity to introduce a minimum number of preferences. Whilst such a requirement marginally reduces the number of exhausted votes it greatly increases the informal vote. The net result is that fewer people have participated in the election.
Above-the-line voting should be abolished and optional preferential voting introduced for the Legislative Council. This would reduce the Legislative Council's disappointingly high informal vote (5.6% in 2003 and 6.1% in 2007) to a level similar to the Legislative Assembly (2.6% in 2003 and 2.7% in 2007).
Redistributions are easy. Most members of Parliament would be unaffected as the electorates would remain basically the same. Because of the size of the electorates, internal movement of voters, such as from country to city, may well result in no net change.
A redistribution occurred in NSW between the 2003 and 2007 elections. The seat of Lachlan was abolished and the seat of Wollondilly was established. Not surprisingly, the electorates in this proposal would have been unaffected by this change.
In the 2003 and 2007 elections in NSW there were no three cornered contests. Neither the Liberal nor the National Party attempted to win a seat from their coalition partner. These inter-party agreements deny the opportunity for Liberal supporters to vote Liberal and National supporters to vote National. These agreements also freeze the respective ratios of the two parties in the parliament. The proposed model allows all voters, whether they live in the city or country, to be able to vote for the party of their choice.
Unfortunately the NSW constitution requires a referendum to implement this system, or any multi-member system for the Legislative Assembly.
At local government level referendums to introduce proportional representation are invariably carried and overseas experience such as in Ireland and New Zealand also demonstrates that the public generally supports the introduction of proportional representation.
Using the proposed five electorates the author has analysed the results of the 2007 and 2003 NSW elections for both the Legislative Assembly and for a thirty eight member (two groups of nineteen) Legislative Council. (See appendices for a detailed breakdown of these results and for simulated results of the current twenty one member Legislative Council elections).
| ||||||||||||||||||||||||||||||||||||||||||||||||||||||||||||||||
| ||||||||||||||||||||||||||||||||||||||||||||||||||||||||||||||||
|
| Electorate | Members | ALP | Liberal | National | Green | Indep |
| North East | 19 | 9 | 4 | 4 | 1 | 1 |
| North | 19 | 7 | 9 | 1 | 2 | - |
| West | 19 | 12 | 4 | 2 | 1 | - |
| South | 19 | 11 | 5 | 2 | 1 | - |
| South East | 19 | 10 | 7 | - | 2 | - |
| Total | 95 | 49 | 29 | 9 | 7 | 1 |
| Actual result with 93 single-member electorates: | ||||||
| 93 | 55 | 20 | 12 | - | 6 | |
|
19 Members to be elected. Quota 5.00%:
| ||||||||||||||||||||||||||||||||
|
ALP 9; Lib/Nat 7; Greens 2; CDP 1.
In the Legislative Council the Shooters Party will not elect a candidate because at only 0.56 of a quota their vote will be less than that obtained by major party candidates after the application of the Robson rotation. Shooters Party preferences will help to determine the final outcome.
19 Members to be elected. Quota 5.00%:
| ||||||||||||||||||||||||||||||||
|
ALP 10; Lib/Nat 7; Greens 2
In the Legislative Council neither the Christian Democratic Party nor the Shooters Party will elect a candidate because at only 0.61 and 0.41 of a quota respectively their votes will be less than that obtained by major party candidates after the application of the Robson rotation. Their preferences will help to determine the final outcome.
The tables above demonstrate that a proportional representation ballot will much more accurately mirror the voting intentions of the electorate. The apparent discrepancy between the percentage of seats won by the major parties and the percentage of votes gained is a direct result of the large independent and minor party vote that either exhausted or flowed, via second and subsequent preferences, to the major parties. (See the analysis of the individual electorates in the appendices)
The 2003 result also demonstrates that one party gaining an absolute majority under proportional representation is not an unreasonable expectation.
The Legislative Council is currently elected by proportional representation and as a result the breakdown of the major parties in both models is very similar. However the current Legislative Council voting system, using above-the-line voting, allows parties such as the Shooters Party to elect candidates, although they were well below gaining a quota, because they have the largest remainder. It is the Robson Rotation with its ability to spread votes within the major party groups that prevents this from happening. In the proposed model no party can expect to elect a candidate unless they can achieve at least 80% of a quota.
With the current proportional representation system for the Legislative Council minor parties gained four positions in both 2007 and 2003. Under the proposed model the minor parties would have gained only three positions in 2007 and two in 2003.
A reduction in the size of the Legislative Council so that only nineteen are elected at each election, the quota for election being raised from 4.55% to 5.00%, makes it even more difficult for minor parties to be elected.
The simulated results, using the five nineteen member electorates, allow every voter who voted for either the Labor, Liberal, National or Green parties to have an excellent chance of having the candidate for whom they voted elected to the parliament. This gives the citizens of NSW a real ownership of the result.
Voters who chose to support independents and minor parties (other than the Greens) would mostly fail to elect their candidate, as they do under the current system, but are then in the position to either choose another candidate or, knowing that they had made their protest, allow their vote to exhaust. It is expected that as these voters become more aware of the potential of proportional representation, they will find a candidate representing their views amongst the major party groups.
The proposed model discourages tactical voting. Labor, Liberal, National and Green Party voters, in every part of the State, will know that the best way to help their party is to vote for their favourite candidate within that party group; to then give second and subsequent preferences to other candidates within the group and then if they feel strongly enough to vote for candidates in other groups. In most cases the vote will not progress past the first preference.
If a voter does not know any of the candidates but only wishes to vote for a particular party then the Robson rotation will ensure that each candidate has an equal chance of being at the top of the group. If the voter chooses to vote for a popular candidate, such as the party leader, the Robson rotation ensures that the position next on the party group is shared equally between all other candidates within the group. Whilst the party leader may gain a number of quotas on the first count, the Robson rotation will ensure that the surplus is shared evenly amongst the other candidates helping to give every candidate in the group a percentage of a quota in excess of the independent and minor party candidates.
It is the Robson rotation that prevents candidates being elected unless they can achieve a substantial percentage of the vote in their own right.
Initially, with the Legislative Assembly being elected by proportional representation, minority governments are likely to be the norm. However, as shown in the ACT Legislative Assembly, as voters better understand the system support for Independents and minor party candidates is expected to decline.
Paradoxically, large electorates with smaller quotas are less likely to lead to minority governments than small electorates with large quotas. At the 2003 State election the Labor Party, with only 42.6% of the primary vote, would have secured, under this proposal, an absolute majority. In 2007 the Labor Party would have been in a position to form a minority Government.
This model will bring actual political power back to the entire electorate where it belongs. Every vote is of equal value and every voter of equal importance regardless of where they live. The election of a government should not be a matter of luck; a few hundred votes in a small number of marginal seats should not determine the result.
| Party | North East | North | West | South | South East | Totals |
| ALP | 8 | 5 | 11 | 10 | 10 | 44 |
| Liberal | 3 | 11 | 4 | 6 | 7 | 31 |
| National | 5 | 1 | 2 | 2 | - | 10 |
| Green | 2 | 2 | 1 | 1 | 2 | 8 |
| Christian Democratic | 1 | 1 | ||||
| Independent | 1 | 1 | ||||
| Totals | 19 | 19 | 19 | 19 | 19 | 95 |
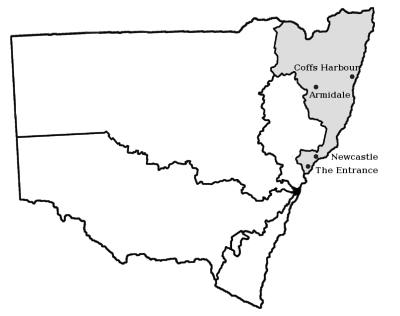 The nineteen member electorate of North East incorporates the current
State electorates of The Entrance, Wyong, Swansea, Charlestown, Lake
Macquarie, Cessnock, Wallsend, Newcastle, Port Stephens. Maitland,
Myall Lakes, Port Macquarie, Oxley, Coffs Harbour, Clarence, Northern
Tablelands, Lismore, Ballina, Tweed.
The nineteen member electorate of North East incorporates the current
State electorates of The Entrance, Wyong, Swansea, Charlestown, Lake
Macquarie, Cessnock, Wallsend, Newcastle, Port Stephens. Maitland,
Myall Lakes, Port Macquarie, Oxley, Coffs Harbour, Clarence, Northern
Tablelands, Lismore, Ballina, Tweed.
Results are analysed from votes cast at the 2007 NSW State election in the following existing electorates.
19 Members to be elected:
| Party | Seats contested | Total Votes | % | Quota |
| ALP | 19 | 271622 | 34.3 | 6.68 |
| Liberal | 9 | 98925 | 12.2 | 2.43 |
| National | 10 | 186073 | 22.9 | 4.57 |
| Greens | 19 | 71886 | 8.8 | 1.77 |
| Christian Democratic | 9 | 11082 | 1.4 | 0.27 |
| AAFI | 11 | 10554 | 1.3 | 0.26 |
| Democrats | 4 | 3303 | 0.4 | 0.08 |
| TFP | 2 | 4829 | 0.6 | 0.12 |
| Torbay (N. Tablelands) | 1 | 32615 | 4.0 | 0.80 |
| Oakeshott (P. Macquarie) | 1 | 28523 | 3.5 | 0.70 |
| Piper (Lake Macquarie) | 1 | 12917 | 1.6 | 0.32 |
| Comb Indep | 81354 | 10.0 | 1.99 | |
| Total Votes: | 813683 | |||
| Quota: 40685 |
The Robson rotation will give the ALP eight seats, (the perfect split gives each candidate 0.83 quotas), the Liberals three seats (0.81 quotas each), the Nationals 5 seats (0.91 quotas each), and the Greens two seats (0.88 quotas each). The last position will go to the Independent Torbay (0.80 quotas). Oakeshott (0.70 quotas) will not be elected.
This result would not change even if one of the major party candidates, such as a party leader, received the great majority of the votes, because the Robson rotation would ensure that any surplus would go evenly to all of the party's other candidates.
Result:
ALP 8, Liberal 3, National 5, Greens 2, Independent 1 (Torbay).
Actual 2007 State Election Result:
ALP 8, Liberal 1, National 7, Independent 3 (Torbay, Oakeshott, Piper).
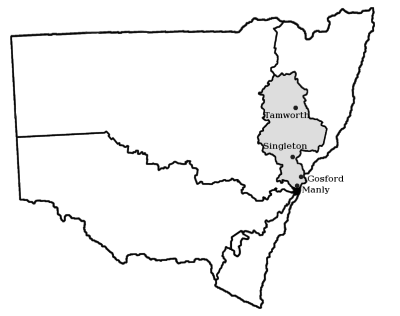 The nineteen member electorate of North incorporates the current State
electorates of North Shore, Manly, Wakehurst, Pittwater, Davidson,
Willoughby, Lane Cove, Ryde, Epping, Ku-Ring-Gai, Hornsby, Castle
Hill, Hawkesbury, Riverstone, Gosford, Terrigal, Upper Hunter, Tamworth.
The nineteen member electorate of North incorporates the current State
electorates of North Shore, Manly, Wakehurst, Pittwater, Davidson,
Willoughby, Lane Cove, Ryde, Epping, Ku-Ring-Gai, Hornsby, Castle
Hill, Hawkesbury, Riverstone, Gosford, Terrigal, Upper Hunter, Tamworth.
19 Members to be elected:
| Party | Seats contested | Total Votes | % | Quota |
| ALP | 19 | 185244 | 24.1 | 4.82 |
| Liberal | 17 | 331887 | 43.2 | 8.63 |
| National | 2 | 44254 | 5.8 | 1.15 |
| Greens | 19 | 75708 | 9.8 | 1.97 |
| Christian Democratic | 14 | 18882 | 2.5 | 0.49 |
| AAFI | 13 | 11789 | 1.5 | 0.31 |
| Democrats | 10 | 9101 | 1.2 | 0.24 |
| SOS | 2 | 959 | 0.1 | 0.02 |
| Unity | 7 | 9197 | 1.2 | 0.24 |
| ORP | 1 | 501 | 0.1 | 0.01 |
| Barr (Manly) | 1 | 12655 | 1.6 | 0.33 |
| Draper (Tamworth) | 1 | 20531 | 2.7 | 0.53 |
| Comb Indep | 48098 | 6.3 | 1.25 | |
| Total Votes: | 768806 | |||
| Quota: 38441 |
The Robson rotation will give the ALP five seats, (the perfect split gives each candidate 0.96 quotas) the Liberals ten seats (0.86 quotas each) and the Nationals with 1.15 quotas will take one seat, the Greens two seats (0.99 quotas each). The last position will be contested between the ALP and the Liberals. The ALP can share six seats with 0.80 quotas each and the Liberals can share eleven seats 0.78 quotas each. On the balance of probabilities, and because of the small National Party surplus and large votes for conservative independents, this position is given to the Liberals.
Result:
ALP 5, Liberal 11, National 1, Greens 2.
Actual 2007 State Election Result:
ALP 3, Liberal 12, National 1, Independent 2 (Barr, Draper).
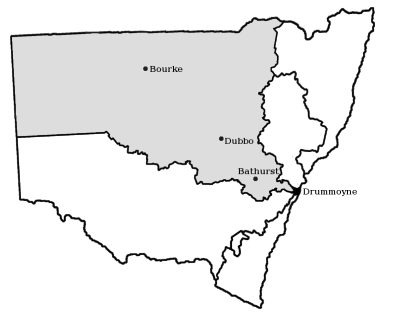 The nineteen member electorate of West incorporates the current State
electorates of Drummoyne, Auburn, Parramatta, Baulkham Hills, Toongabbie,
Granville, Fairfield, Cabramatta, Smithfield, Blacktown, Mount Druitt,
Mulgoa, Londonderry, Penrith, Blue Mountains, Bathurst, Orange, Dubbo,
Barwon.
The nineteen member electorate of West incorporates the current State
electorates of Drummoyne, Auburn, Parramatta, Baulkham Hills, Toongabbie,
Granville, Fairfield, Cabramatta, Smithfield, Blacktown, Mount Druitt,
Mulgoa, Londonderry, Penrith, Blue Mountains, Bathurst, Orange, Dubbo,
Barwon.
19 Members to be elected:
| Party | Seats contested | Total Votes | % | Quota |
| ALP | 19 | 375565 | 46.8 | 9.36 |
| Liberal | 15 | 179653 | 22.4 | 4.48 |
| National | 4 | 71823 | 8.9 | 1.79 |
| Greens | 19 | 50314 | 6.3 | 1.25 |
| Christian Democratic | 13 | 28901 | 3.6 | 0.72 |
| AAFI | 13 | 16011 | 2.0 | 0.40 |
| Democrats | 3 | 2202 | 0.3 | 0.05 |
| Unity | 10 | 17111 | 2.1 | 0.43 |
| ORP | 2 | 1066 | 0.1 | 0.03 |
| Fardell (Dubbo) | 1 | 18296 | 2.3 | 0.46 |
| Comb Indep | 41609 | 5.2 | 1.04 | |
| Total Votes: | 802551 | |||
| Quota: 40128 |
The Robson rotation will give the ALP ten seats, (the perfect split gives each candidate 0.93 quotas) the Liberals and Nationals have a combined vote of over six quotas and because of the large independent vote in country areas, the resulr is given as Liberal four seats and National two seats, the Greens one seat (1.25 quotas), the Christian Democratic Party one seat (0.72 quotas but only contested 13 of the 19 seats). The last position will be contested between the ALP and the Liberals. On the balance of probabilities, the likelihood of Labor voters voting tactically for country independents and the reduction of the conservative vote in the city with the election of the CDP given to the ALP.
Result:
ALP 11, Liberal 4, National 2, Greens 1, CDP 1.
Actual 2007 State Election Result:
ALP 15, Liberal 1, National 2, Independent 1 (Fardell).
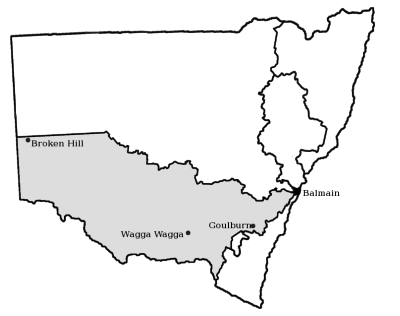 The nineteen member electorate of South incorporates the current State
electorates of Balmain, Marrickville, Strathfield, Canterbury, Lakemba,
Bankstown, East Hills, Menai, Liverpool, Macquarie Fields, Campbelltown,
Camden, Wollondilly, Goulburn, Burrinjuck, Murrumbidgee, Wagga Wagga,
Albury, Murray Darling.
The nineteen member electorate of South incorporates the current State
electorates of Balmain, Marrickville, Strathfield, Canterbury, Lakemba,
Bankstown, East Hills, Menai, Liverpool, Macquarie Fields, Campbelltown,
Camden, Wollondilly, Goulburn, Burrinjuck, Murrumbidgee, Wagga Wagga,
Albury, Murray Darling.
19 Members to be elected:
| Party | Seats contested | Total Votes | % | Quota |
| ALP | 19 | 365698 | 45.9 | 9.18 |
| Liberal | 16 | 212321 | 26.7 | 5.33 |
| National | 3 | 77629 | 9.7 | 1.95 |
| Greens | 19 | 70637 | 8.9 | 1.77 |
| Christian Democratic | 11 | 19047 | 2.4 | 0.48 |
| AAFI | 9 | 11405 | 1.4 | 0.29 |
| Democrats | 5 | 3356 | 0.4 | 0.08 |
| Unity | 7 | 9954 | 1.3 | 0.25 |
| SA | 1 | 666 | 0.1 | 0.02 |
| Stephenson (Goulburn) | 1 | 10603 | 1.3 | 0.27 |
| Comb Indep | 15068 | 1.9 | 0.38 | |
| Total Votes: | 796284 | |||
| Quota: 39815 |
The Robson rotation will give the ALP ten seats, (the perfect split gives each candidate 0.91 quotas), the Liberals six seats (0.88 quotas each) and the Nationals with 1.95 quotas will take two seats. The Greens, even with 1.75 quotas, will only win one seat.
Result:
ALP 10, Liberal 6, National 2, Greens 1.
Actual 2007 State Election Result:
ALP 13, Liberal 3, National 3.
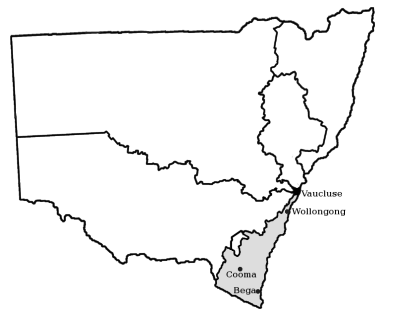 The nineteen member electorate of South East incorporates the current State
electorates of Vaucluse, Sydney, Coogee, Maroubra, Heffron, Rockdale, Kogarah,
Cronulla, Miranda, Oatley, Heathcote, Keira, Wollongong, Shell Harbour,
Kiama, South Coast, Monaro and Bega.
The nineteen member electorate of South East incorporates the current State
electorates of Vaucluse, Sydney, Coogee, Maroubra, Heffron, Rockdale, Kogarah,
Cronulla, Miranda, Oatley, Heathcote, Keira, Wollongong, Shell Harbour,
Kiama, South Coast, Monaro and Bega.
19 Members to be elected:
| Party | Seats contested | Total Votes | % | Quota |
| ALP | 19 | 337731 | 44.5 | 8.90 |
| Liberal | 18 | 238483 | 31.4 | 6.29 |
| National | 1 | 16244 | 2.1 | 0.43 |
| Greens | 19 | 84260 | 11.1 | 2.22 |
| Christian Democratic | 10 | 19507 | 2.6 | 0.51 |
| AAFI | 10 | 9829 | 1.3 | 0.26 |
| Democrats | 4 | 3137 | 0.4 | 0.08 |
| Unity | 6 | 7030 | 0.9 | 0.19 |
| SOS | 1 | 461 | 0.1 | 0.01 |
| SA | 1 | 591 | 0.1 | 0.02 |
| TFP | 1 | 1680 | 0.2 | 0.04 |
| Moore (Sydney) | 1 | 16316 | 2.2 | 0.43 |
| Comb Indep | 23381 | 3.1 | 0.62 | |
| Total Votes: | 758650 | |||
| Quota: 37933 |
The ALP will take nine seats, the combined Liberal/National vote will give the Liberals seven seats and the Greens have two seats (2.22 quotas). The last position will be contested between the ALP and the Liberals. On the basis of their better Robson rotation split, and with the support of the Greens' surplus this position is given to the ALP.
Result:
ALP 10, Liberal 7, Greens 2.
Actual 2007 State Election Result:
ALP 13, Liberal 4, Independent 1 (Moore).
19 Members to be elected:
| No. | Name | Votes | % | Quota |
| A | Group A | 25942 | 0.7 | 0.14 |
| B | Fishing Party | 58340 | 1.5 | 0.31 |
| C | AAFI | 62386 | 1.6 | 0.33 |
| D | Group D | 456 | 0.0 | - |
| E | Liberal/Nationals | 1304166 | 34.2 | 6.84 |
| F | Group F | 18999 | 0.5 | 0.10 |
| G | Democrats | 67994 | 1.8 | 0.36 |
| H | Group H | 3143 | 0.1 | 0.02 |
| I | Greens | 347548 | 9.1 | 1.82 |
| J | Unity Party | 46053 | 1.2 | 0.24 |
| K | Christian Democratic | 168545 | 4.4 | 0.88 |
| L | Restore Workers Rights | 35218 | 0.9 | 0.18 |
| M | Group M | 3464 | 0.1 | 0.02 |
| N | Shooters Party | 106513 | 2.8 | 0.56 |
| O | Labor | 1491719 | 39.1 | 7.83 |
| P | Horse Riders Outdoor Rec | 21569 | 0.6 | 0.11 |
| Q | Socialist Alliance | 15142 | 0.4 | 0.08 |
| R | Save Our Suburbs | 11951 | 0.3 | 0.06 |
| S | Human Rights | 16772 | 0.4 | 0.09 |
| T | Ungrouped | 5325 | 0.1 | 0.03 |
| Total Votes: | 3811245 | |||
| Quota: 190563 |
The ALP will win eight seats, the combined Liberal/National vote will give the Liberals seven seats and the Greens have one seat. The last three positions are interesting. If the Greens can share their vote equally they will take two seats on Democrat preferences. However the Robson rotation does not work effectively when a party has less than two quotas because one candidate will invariably be seen as the leader and take a full quota, leaving the other candidate will a smaller remainder. Because of their better Robson rotation the ALP will take one of the last three, and on the balance of probabilities the CDP and the Liberals will take the other two seats.
Result:
ALP 9, Liberal 8, Greens 1, CDP 1.
21 Members to be elected:
| No. | Name | Votes | % | Quota |
| A | Group A | 25942 | 0.7 | 0.15 |
| B | Fishing Party | 58340 | 1.5 | 0.34 |
| C | AAFI | 62386 | 1.6 | 0.36 |
| D | Group D | 456 | 0.0 | - |
| E | Liberal/Nationals | 1304166 | 34.2 | 7.53 |
| F | Group F | 18999 | 0.5 | 0.11 |
| G | Democrats | 67994 | 1.8 | 0.39 |
| H | Group H | 3143 | 0.1 | 0.02 |
| I | Greens | 347548 | 9.1 | 2.01 |
| J | Unity Party | 46053 | 1.2 | 0.27 |
| K | Christian Democratic | 168545 | 4.4 | 0.97 |
| L | Restore Workers Rights | 35218 | 0.9 | 0.20 |
| M | Group M | 3464 | 0.1 | 0.02 |
| N | Shooters Party | 106513 | 2.8 | 0.61 |
| O | Labor | 1491719 | 39.1 | 8.61 |
| P | Horse Riders Outdoor Rec | 21569 | 0.6 | 0.12 |
| Q | Socialist Alliance | 15142 | 0.4 | 0.09 |
| R | Save Our Suburbs | 11951 | 0.3 | 0.07 |
| S | Human Rights | 16772 | 0.4 | 0.10 |
| T | Ungrouped | 5325 | 0.1 | 0.03 |
| Total Votes: | 3811245 | |||
| Quota: 173239 |
The smaller quotas required to elect twenty one members make this result easier to read. The better Robson rotation split will give the ALP ten seats leaving the Liberal/National coalition with eight seats. The Greens will take two seats and the CDP will take one seat.
With the current above-the-line voting system the Shooters Party win a seat with only 2.8% of the vote or 0.61 of a quota. Under the proposed model they would need at least 4.0% or 0.88 of a quota to have any likelihood of success.
Result:
ALP 10, Liberal 8, Greens 2, CDP 1.
Actual 2007 State Election Result:
ALP 9, Liberal 8, Greens 2, CDP 1, Shooters 1.
| Party | North East | North | West | South | South East | Totals |
| ALP | 9 | 7 | 12 | 11 | 10 | 49 |
| Liberal | 4 | 9 | 4 | 5 | 7 | 29 |
| National | 4 | 1 | 2 | 2 | - | 9 |
| Green | 1 | 2 | 1 | 1 | 2 | 7 |
| Independent | 1 | 1 | ||||
| Totals | 19 | 19 | 19 | 19 | 19 | 95 |
The nineteen member electorate of North East incorporates the current
State electorates of The Entrance, Wyong, Swansea, Charlestown, Lake
Macquarie, Cessnock, Wallsend, Newcastle, Port Stephens. Maitland,
Myall Lakes, Port Macquarie, Oxley, Coffs Harbour, Clarence,
Northern Tablelands, Lismore, Ballina, Tweed.
19 Members to be elected:
| Party | Seats contested | Total Votes | % | Quota |
| ALP | 19 | 316658 | 39.6 | 7.92 |
| Liberal | 9 | 117958 | 14.8 | 2.95 |
| National | 10 | 160084 | 20.0 | 4.00 |
| Greens | 19 | 75890 | 7.49 | 1.05 |
| Christian Democratic | 10 | 9991 | 1.2 | 0.25 |
| AAFI | 7 | 4738 | 0.6 | 0.12 |
| Democrats | 12 | 7848 | 1.0 | 0.20 |
| One Nation | 17 | 15167 | 1.9 | 0.38 |
| SOS | 2 | 707 | 0.1 | 0.02 |
| SA | 2 | 517 | 0.1 | 0.01 |
| Unity Party | 2 | 289 | 0.0 | 0.01 |
| FP | 2 | 1773 | 0.2 | 0.04 |
| Oakeshott (P. Macquarie) | 1 | 30659 | 3.8 | 0.77 |
| Torbay (N. Tablelands) | 1 | 28149 | 3.5 | 0.70 |
| Comb Indep | 40353 | 5.0 | 1.01 | |
| Total Votes: | 799620 | |||
| Quota: 39982 |
The Robson rotation will give the ALP nine seats, (the perfect split gives each candidate 0.88 quotas), the Liberals and the Nationals will share eight seats (the combined Robson rotation gives each of the eight candidates 0.86 quotas). On the balance of probabilities, Liberal four and National four. The Greens win one seat. The last position will go to the Independent Oakeshott (0.77 of a quota). Torbay (0.70 of a quota) will not be elected.
Result:
ALP 9, Liberal 4, National 4, Greens 1, Independent (Oakeshott) 1.
Actual 2003 State Election Result:
ALP 11, National 6, Independent 2 (Torbay, Oakeshott).
The nineteen member electorate of North incorporates the current State
electorates of North Shore, Manly, Wakehurst, Pittwater, Davidson,
Willoughby, Lane Cove, Ryde, Epping, Ku-Ring-Gai, Hornsby, The Hills,
Hawkesbury, Riverstone, Gosford, Peats, Upper Hunter, Tamworth.
19 Members to be elected:
| Party | Seats contested | Total Votes | % | Quota |
| ALP | 19 | 224254 | 29.8 | 5.95 |
| Liberal | 17 | 301511 | 40.0 | 8.00 |
| National | 2 | 37486 | 5.0 | 1.00 |
| Greens | 19 | 67760 | 9.0 | 1.80 |
| Christian Democratic | 12 | 16164 | 2.1 | 0.43 |
| AAFI | 10 | 6790 | 0.9 | 0.18 |
| Democrats | 15 | 10680 | 1.4 | 0.28 |
| Unity Party | 14 | 12279 | 1.6 | 0.33 |
| One Nation | 4 | 707 | 0.1 | 0.02 |
| SOS | 2 | 1229 | 0.2 | 0.03 |
| Draper (Tamworth) | 1 | 16630 | 2.2 | 0.44 |
| Barr (Manly) | 1 | 12969 | 1.7 | 0.34 |
| Reilly (Willoughby) | 1 | 10237 | 1.4 | 0.27 |
| Comb Indep | 31743 | 4.2 | 0.84 | |
| Total Votes: | 753426 | |||
| Quota: 37672 |
The Robson rotation will give the ALP seven seats and the Liberals nine seats, the Nationals one seat and the Greens one seat. The last seat will go to the Greens as their vote is sufficiently high to enable them to remain in the count until all other candidates have been excluded.
Result:
ALP 7, Liberal 9, National 1, Greens 2.
Actual 2003 State Election Result:
ALP 3, Liberal 13, National 1, Independent 1 (Draper).
The nineteen member electorate of West incorporates the current State
electorates of Drummoyne, Auburn, Parramatta, Baulkham Hills,
Wentworthville, Granville, Fairfield, Cabramatta, Smithfield, Blacktown,
Mount Druitt, Mulgoa, Londonderry, Penrith, Blue Mountains, Bathurst,
Orange, Dubbo, Barwon.
19 Members to be elected:
| Party | Seats contested | Total Votes | % | Quota |
| ALP | 19 | 385950 | 50.7 | 10.14 |
| Liberal | 14 | 145900 | 19.2 | 3.83 |
| National | 4 | 65769 | 8.6 | 1.73 |
| Greens | 19 | 45119 | 5.9 | 1.19 |
| Christian Democratic | 13 | 20200 | 2.7 | 0.53 |
| AAFI | 13 | 11257 | 1.5 | 0.30 |
| Democrats | 12 | 7408 | 1.0 | 0.19 |
| Unity Party | 13 | 15603 | 2.1 | 0.41 |
| One Nation | 13 | 10176 | 1.3 | 0.27 |
| SOS | 3 | 3063 | 0.4 | 0.08 |
| RLS | 1 | 201 | 0.0 | 0.01 |
| SA | 1 | 172 | 0.0 | 0.00 |
| McGrane (Dubbo) | 1 | 16696 | 2.2 | 0.44 |
| Falconer (Londonderry) | 1 | 7800 | 1.0 | 0.20 |
| Comb Indep | 25774 | 3.4 | 0.68 | |
| Total Votes: | 761088 | |||
| Quota: 38055 |
The Robson rotation will give the ALP twelve seats. The Liberals will take four seats, the Nationals two and the Greens one.
Result:
ALP 12, Liberal 4, National 2, Greens 1.
Actual 2003 State Election Result:
ALP 15, Liberal 1, National 2, Independent 1 (Fardell).
The nineteen member electorate of South incorporates the current
State electorates of Port Jackson, Marrickville, Strathfield,
Canterbury, Lakemba, Bankstown, East Hills, Menai, Liverpool,
Macquarie Fields, Campbelltown, Camden, Southern Highlands,
Burrinjuck, Murrumbidgee, Wagga Wagga, Albury, Lachlan, Murray Darling.
19 Members to be elected:
| Party | Seats contested | Total Votes | % | Quota |
| ALP | 19 | 369203 | 47.3 | 9.46 |
| Liberal | 15 | 179555 | 23.0 | 4.60 |
| National | 4 | 86756 | 11.1 | 2.22 |
| Greens | 19 | 63706 | 8.2 | 1.63 |
| Christian Democratic | 7 | 7812 | 1.0 | 0.20 |
| AAFI | 7 | 5666 | 0.7 | 0.15 |
| Democrats | 10 | 6187 | 0.8 | 0.16 |
| Unity Party | 11 | 2585 | 0.3 | 0.07 |
| One Nation | 13 | 13423 | 1.7 | 0.34 |
| SOS | 2 | 1547 | 0.2 | 0.04 |
| SA | 2 | 2585 | 0.3 | 0.07 |
| RLS | 2 | 807 | 0.1 | 0.02 |
| FP | 1 | 649 | 0.1 | 0.02 |
| Comb Indep | 29042 | 3.7 | 0.74 | |
| Total Votes: | 780398 | |||
| Quota: 39020 |
The Robson rotation will give the ALP ten seats and the Liberals five seats, the Nationals two and the Greens one. The last seat will go to the ALP on Greens preferences. Above-the-line voting may have given the Greens an extra seat at the expense of the ALP. However the Robson rotation ensures that it is the Greens' candidate whose preferences are distributed.
Result:
ALP 11, Liberal 5, National 2, Greens 1.
Actual 2003 State Election Result:
ALP 13, Liberal 3, National 3.
The nineteen member electorate of South East incorporates
the current State electorates of
Vaucluse, Bligh, Coogee, Maroubra, Heffron, Rockdale, Kogarah, Cronulla,
Miranda, Georges River, Heathcote, Keira, Wollongong, Illawarra, Kiama,
South Coast, Monaro, Bega.
19 Members to be elected:
| Party | Seats contested | Total Votes | % | Quota |
| ALP | 19 | 334953 | 46.1 | 9.21 |
| Liberal | 18 | 199964 | 27.5 | 5.50 |
| National | 1 | 17909 | 2.5 | 0.49 |
| Greens | 19 | 74056 | 10.2 | 2.04 |
| Christian Democratic | 10 | 11806 | 1.6 | 0.32 |
| AAFI | 9 | 6151 | 0.8 | 0.17 |
| Democrats | 6 | 3354 | 0.5 | 0.09 |
| Unity Party | 11 | 7966 | 1.1 | 0.22 |
| One Nation | 9 | 6386 | 0.9 | 0.18 |
| SOS | 2 | 1118 | 0.2 | 0.03 |
| SA | 1 | 187 | 0.0 | 0.00 |
| HRP | 1 | 368 | 0.1 | 0.01 |
| Moore (Bligh) | 1 | 15330 | 2.1 | 0.42 |
| Comb Indep | 47724 | 6.6 | 1.3 | |
| Total Votes: | 727272 | |||
| Quota: 36364 |
The Robson rotation will give the ALP ten seats and the Liberals six seats. The Greens have two seats. The last seat will go to the Liberals on National Party preferences.
Result:
ALP 11, Liberal 7, Greens 2.
Actual 2003 State Election Result:
ALP 13, Liberal 4, Independent 1 (Moore).
19 Members to be elected:
| No. | Name | Votes | % | Quota |
| A | Liberal/Nationals | 1239107 | 33.3 | 6.66 |
| B | One Nation | 55396 | 1.5 | 0.30 |
| C | Shooters Party | 76133 | 2.0 | 0.41 |
| D | No Privatisation Peoples Party | 6652 | 0.2 | 0.04 |
| E | AAFI | 33409 | 0.9 | 0.18 |
| F | Labor | 1620190 | 43.5 | 8.71 |
| G | Save Our Suburbs | 18033 | 0.5 | 0.10 |
| H | Democrats | 58494 | 1.6 | 0.31 |
| I | Unity Party | 52979 | 1.4 | 0.28 |
| J | Socialist Alliance 5 | 428 | 0.1 | 0.03 |
| K | Greens | 320010 | 8.6 | 1.72 |
| L | Group L (Hanson) | 71368 | 1.9 | 0.38 |
| M | Reform the Legal System | 9644 | 0.3 | 0.05 |
| N | Christian Democratic | 112865 | 3.0 | 0.61 |
| O | Fishing/Horse Riders/Four Wheel | 39315 | 1.1 | 0.21 |
| P | Ungrouped | 2434 | 0.1 | 0.01 |
| Total Votes: | 3721457 | |||
| Quota: 186073 |
The Robson rotation split will give the ALP nine seats and the Liberal/National coalition seven seats. The Greens will take one seat. On the basis of their better Robson rotation split, the ALP and the Liberal/Nationals will each take one of the last two seats, the ALP on Greens surplus and the Liberal/Nationals on CDP preferences.
Result:
ALP 10, Liberal 8, Greens 1.
21 Members to be elected:
| No. | Name | Votes | % | Quota |
| A | Liberal/Nationals | 1239107 | 33.3 | 7.33 |
| B | One Nation | 55396 | 1.5 | 0.33 |
| C | Shooters Party | 76133 | 2.0 | 0.45 |
| D | No Privatisation Peoples Party | 6652 | 0.2 | 0.04 |
| E | AAFI | 33409 | 0.9 | 0.20 |
| F | Labor | 1620190 | 43.5 | 9.58 |
| G | Save Our Suburbs | 18033 | 0.5 | 0.11 |
| H | Democrats | 58494 | 1.6 | 0.35 |
| I | Unity Party | 52979 | 1.4 | 0.31 |
| J | Socialist Alliance 5 | 428 | 0.1 | 0.03 |
| K | Greens | 320010 | 8.6 | 1.89 |
| L | Group L (Hanson) | 71368 | 1.9 | 0.42 |
| M | Reform the Legal System | 9644 | 0.3 | 0.06 |
| N | Christian Democratic | 112865 | 3.0 | 0.67 |
| O | Fishing/Horse Riders/Four Wheel | 39315 | 1.1 | 0.23 |
| P | Ungrouped | 2434 | 0.1 | 0.01 |
| Total Votes: | 3721457 | |||
| Quota: 169158 |
The Robson rotation split will give the ALP eleven seats and the Liberal/National coalition eight seats. The Greens will win two seats, the second on Democrat preferences.
With the current above-the-line voting system both the CDP and the Shooters Party, with 3.0% and 2.0% respectively, won a seat. Under the proposed model both parties would need at least 4.0% or 0.88 of a quota to have any likelihood of success.
Result:
ALP 11, Liberal 8, Greens 2.
Actual 2003 State Election Result:
ALP 10, Liberal 7, Greens 2. CDP 1, Shooters 1.